Thermal Deformation and Dynamic Recrystallization of 17-4PH Stainless Steel.(HY-industry technical centre)
HY research results of 17-4PH Stainless Steel:
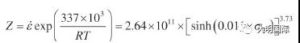
Hot deformation behavior of 17-4PH Stainless Steel was studied by compression test. Not only the typical unimodal dynamic recrystallization (DRX) behavior, but also the transition state between unimodal and multimodal (cyclic) behavior was observed in the obtained rheological curve. The determination of the hot working constant by using the constitutive equation is discussed. Therefore, the deformation activation energy and stress multiplication in the hyperbolic sine equation are determined to be 337 kJ / mol and 0.011, respectively. The Zener-Hollomon parameter (Z) power based on the peak stress and peak strain of the power relationship was determined to be 0.18 and 0.11, respectively. The normalized critical stresses and strains that induced DRX were found to be 0.89 and 0.47, respectively. The microstructure of the hot deformed specimen was studied. The electrolytic austenite corrosion of martensite revealed the original austenite grain boundary (PAGB). Due to the necklace DRX mechanism, significant grain refinement occurred. According to the power equations with indices of -0.25 and -1.24, respectively, the average dynamic recrystallization grain size is related to the Z parameter and the peak value. In order to show the effect of deformation conditions on the generation of DRX and the effect on the final grain size, we have drawn a DRX map.
Summary
Hot deformation behavior of 17-4PH Stainless Steel was studied by compression test. Not only the typical unimodal dynamic recrystallization (DRX) behavior, but also the transition state between unimodal and multimodal (cyclic) behavior was observed in the obtained rheological curve. The determination of the hot working constant by using the constitutive equation is discussed. Therefore, the deformation activation energy and stress multiplication in the hyperbolic sine equation are determined to be 337 kJ / mol and 0.011, respectively.
The Zener-Hollomon parameter (Z) power based on the peak stress and peak strain of the power relationship was determined to be 0.18 and 0.11, respectively. The normalized critical stresses and strains that induced DRX were found to be 0.89 and 0.47, respectively. The microstructure of the hot deformed specimen was studied. The electrolytic austenite corrosion of martensite revealed the original austenite grain boundary (PAGB).
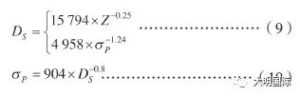
Due to the necklace DRX mechanism, significant grain refinement occurred. According to the power equations with indices of -0.25 and -1.24, respectively, the average dynamic recrystallization grain size is related to the Z parameter and the peak value. In order to show the effect of deformation conditions on the generation of DRX and the effect on the final grain size, we have drawn a DRX map.
Foreword
Knowledge of the microstructure can be used to infer the properties of the material. Phase and defect state, size, distribution, and orientation are important characteristics of microstructures. Among them, defects such as determining grain boundaries of the grain structure are very important. Two independent studies: Hall’s study of factors affecting the mechanical properties of various steels and Petch’s study of factors affecting the brittle fatigue of various steels, leading to the well-known Hall-Petch relationship, which mathematically illustrates the grain size Dependence on strength. It is well known that grain size refinement is a method of increasing strength while maintaining ductility.
In order to make steel have the required mechanical strength without increasing production costs, the thermal deformation treatment process is irreplaceable. The core is to improve the performance of the material through processing rather than alloying. Therefore, to form a fine microstructure with the desired phase shape, size, distribution, and orientation, it is necessary to carefully control the molding process parameters. During and after thermal deformation of steel, various phenomena such as dynamic recrystallization (DRX), sub-dynamic recrystallization (MDRX), static recrystallization (SRX), and austenite pancaking can be performed, Precipitation and phase transitions use different strategies to refine the microstructure. During thermal deformation, grain refining can be achieved through dynamic recrystallization. In some materials, such as aluminum, dynamic recovery (DRV) can offset work hardening to a stable level.
However, in many materials, such as the austenite phase in steel, the power of DRV is low, and DRV alone cannot offset work hardening. As a result, due to the gradual increase in the density of strain dislocations, recrystallization eventually occurs during deformation. DRX is one of the most important softening mechanisms in the hot deformation process, which has a significant impact on the microstructure and grain size. Based on this feature, this paper focuses on the microstructure changes of 17-4PH Stainless Steel (AISI 630) and the grain refinement caused by DRX during the compression process.
17-4PH Stainless Steel is more common than any other type of precipitation hardened (PH) stainless steel. Because this steel grade does not severely reduce ductility while increasing its strength and corrosion resistance is better than other steel grades of the same strength, it is favored by design and engineering technicians. The hot deformation process of this steel, such as forging, is performed in a temperature range where the austenite phase is stable.
Due to the low stacking fault energy of austenite in 17-4PH Stainless Steel, the main recovery process during thermal deformation is dynamic recrystallization (DRX). When we reviewed the literature, we did not find any information about the DRX microstructure of this important engineering alloy. Furthermore, it should be noted that the literature on grain refinement of PH stainless steels is also limited.
Test materials and procedures
2.1 Thermal compression test
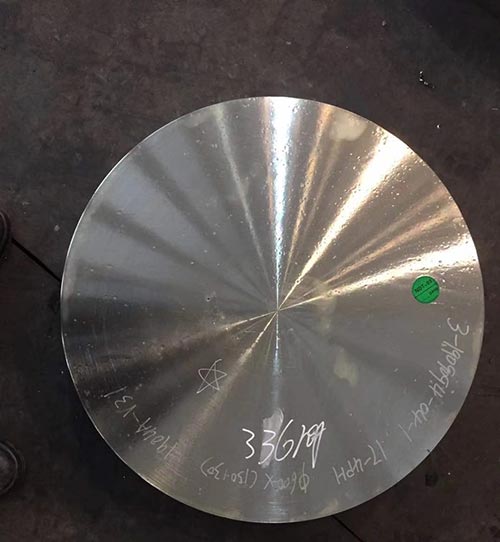
Table 1 shows the chemical composition of the 17-4 PH stainless steel used in this research. The sample used for the thermal compression test was a circular sample with a diameter of 5 mm and a height of 10 mm. The sample was in the shape of Rastegaev, and glass frit was used as a lubricating material for the contact surface of the drill seat and the sample. A Baehr DIL-805 thermal expansion instrument was used to perform the thermal compression test.
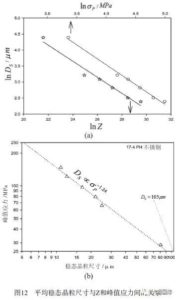
Prior to the start of the test, the samples were austenitized at a temperature of 1180 ° C for 10 minutes, and then held for 5 minutes. After this process, the size of austenite grains is D0 = 105 μm (see Figure 1 (a)). Then, under a true strain of about 0.9, a single thermal compression test was performed at a temperature of 950 to 1150 ° C at a strain rate of 10-3 to 10 s-1.


2.2 Metallography of 17-4PH Stainless Steel
Microstructure of 17-4PH Stainless Steel is martensite at room temperature. However, in order to characterize thermally deformed specimens, the original austenite grain boundaries (PAGBs) should be revealed. Due to the existence of martensite microstructure, it is difficult to reveal the prior austenite grain boundaries in steel. The efficiency of the method used to reveal the primary austenite grain boundaries in steel depends on chemical composition, heat treatment, deformation conditions, and other unknown factors.
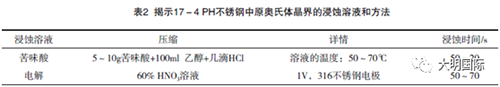
In this study, we found that there are two etching methods that can be used to reveal the austenite grain boundaries in 17-4 PH stainless steel. The first method is electrolytic etching in a 60% HNO3 solution developed for austenitic stainless steel, and the second method is the use of a hot supersaturated picric acid (Superpicral), which is commonly used to reveal the austenite grain boundaries. Table 2 shows the etching solutions and methods used in the study. These etching techniques can be used to reveal annealing (Figure 1 (a)), work hardening (Figure 1 (b)), partial recrystallization (Figures 1 (c) and (Figure 1 (d)), and complete recrystallization (Figure 1 (E) and (Figure 1 (f)) the original austenite grain boundaries. Since the results of electrolytic etching are much better, this technique was used for subsequent microstructure analysis.
Microstructure of 17-4 PH stainless steel used in this study does not contain delta-ferrite fibrous inclusions in the martensite matrix. This may be due to the chromium and nickel contents being close to the minimum (15 <wt% Cr <17.5) and the maximum allowable value (3 <wt% Ni <5), respectively. The chemical composition of this alloy belongs to the category of 15-5 PH stainless steel, and it is a 17-4 PH ferritic stainless steel.
2.3 Preparation of rheological curves
After removing the elastic part, each rheological curve is corrected for friction, and then smoothing is performed to eliminate the bumps and undulations as described below.
Using a suitable lubricant in a thermal compression test can significantly reduce friction, but it cannot completely eliminate friction. Therefore, in order to form friction corrected data, the influence of friction should be considered in the original stress data. Ebrahimi and Najafizadeh proposed a simplified theoretical analysis of the drum compression test for determining the friction constant (m) based on the upper bound theory. The required expression is as follows:
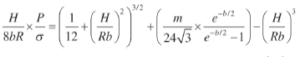
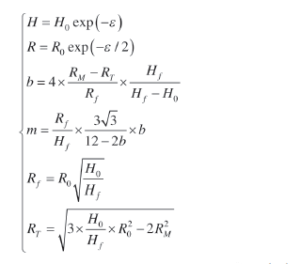
Where σ is the corrected true stress; P is the external pressure (uncorrected stress) applied to the sample during compression; b is the drum parameter; m is the friction constant; R and H are the Radius and height (strain-related variables); R0 and H0 are the initial values of the radius and height of the specimen; Hf is the height of the deformed specimen; RM is the radius of the intermediate height of the deformed specimen; radius.
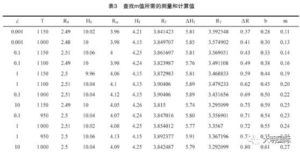
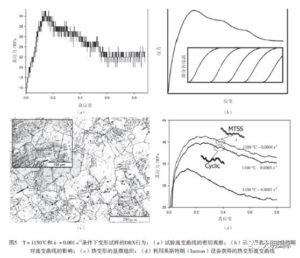
Values R0, H0, Hf, and RM are measured using samples before and after deformation, while the values RT, Rf, b, and m are calculated using formula (2). Then, according to formula (1) and the dependence of R and H on the strain, the value σ is calculated. Table 3 shows the calculation results of the friction correction. As can be seen from the table, friction becomes more and more effective by reducing the deformation temperature and increasing the strain rate. This is more evident in the friction correction curve, as shown in Figure 2 (a). These figures also indicate that the effect of friction is more pronounced at higher strain values, especially after the peak stress point.
It is customary to determine the presence of DRX based on the stress peaks in the rheological curve. However, not all materials show clear peaks when tested under hot working conditions. Ryan and McQueen and Poliak and Jonas show that the onset of DRX can be detected from the tortuous changes in the strain hardening rate versus stress curve. The derivative of the true stress with respect to the true strain gives the work hardening rate, θ (formula (3)).
Therefore, this technique requires differential calculation of the stress-strain curve, but the short-range noise in the rheological curve cannot show this kind of calculus (as shown in Figure 2 (b)). In order to solve this problem, the flow stress data was modified to eliminate irregularities and fluctuations in the test curve (Figure 2 (c)) so that they can be differentially calculated (Figure 2 (d)).
3. Results and discussion
3.1 Hot working behavior of 17-4PH Stainless Steel
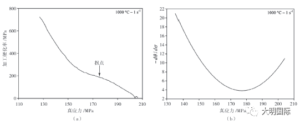
Figure 3 shows the rheological curves under different deformation conditions. Most of the curves have a single peak stress and then gradually decrease toward a steady state stress, which is typical of DRX. However, when the strain rate increases or the deformation temperature decreases, the peak value is no longer obvious. In unimodal behavior, a new cycle of DRX begins before the first cycle is completed.
Therefore, different DRX process stages at different time points have different grains. The rheological curve expresses the average rheological stress of the grains at different recrystallization stages in the form of a unimodal curve. In some cases, such as deformation conditions T = 1100 ° C and ε = 1s-1, the shape of the rheological curve represents a typical dynamic recovery behavior. The inflection point in the θ-σ curve more clearly indicates that DRX occurred. Therefore, θ-σ curve analysis is performed to reveal whether DRX is generated. Figure 4 (a) shows the deformation conditions and the θ-σ curve.
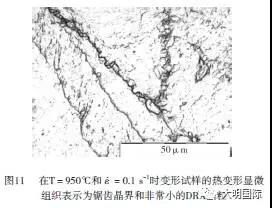
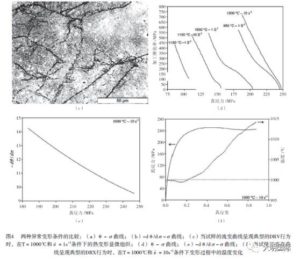
The figure shows that, regardless of the shape of the rheological curve, the sample has obvious inflection points (related to the minimum value of the -dθ / dσ-σ curve shown in Figure 4 (b)), which is possible. Related to the emergence. Figure 4 (c) shows the microstructure of this sample. In this microstructure, some fine grains can be seen at the serrated grain boundaries, which proves that DRX occurs in this case. For the deformation conditions of T = 1000 ° C and ε = 10s-1, the shape of the rheological curve is similar to the typical DRX behavior (Figure 3). In the θ-σ curve (Figure 4 (d)) and -dθ / dσ-σ curve (Figure 4 ( e)), neither a clear inflection point nor a minimum value can be determined. As shown in Figure 4 (f), the softening outside the peak may be attributed to the adiabatic deformation temperature rise at 10 s-1. Flat grain boundaries in the microstructure of the sample also meant that no DRX was present.

It is thought that at low energy storage, the nucleation of DRX starts at the critical strain, which is related to the critical dislocation density and to the pre-existing grain boundary protrusions. These may be primary grain boundaries, dynamic recrystallized grain boundaries, or large-angle grain boundaries formed during the strain process (for example, these are related to deformation range or deformed twins). This mechanism is commonly referred to as strain-induced grain boundary migration (SIBM) and is often used to illustrate the onset of DRX in polycrystals. However, at high energy storage, DRX begins with the growth of large-angle grain boundaries formed by the accumulation of dislocations. The difference in dislocation density before and after the grain boundary is the driving force for DRX core growth.
As shown in Figures 1 (c) and 1 (d), nucleation occurs mainly along the existing grain boundaries (necklace mechanism), and with the increase of new grain dislocation density and the drive of further growth The reduction in force causes simultaneous deformation and also stops the growth of each grain. DRX stopped after the first layer of necklace covering the entire grain boundary was completed. Then, the subsequent layers are formed at the recrystallization front between the recrystallized and non-recrystallized portions. If stress oscillations occur before reaching steady state, then several recrystallization and grain growth cycles tend to disappear before steady state strain occurs. The stress behavior is referred to as periodic peak or multimodal type. In this case, grain growth is stopped by boundary impact rather than simultaneous deformation.
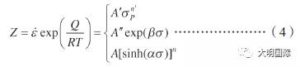
In this study, even at a very low strain rate of 0.001s-1 and a high temperature of 1150 ° C, there is no evidence of traditional multimodality in the rheological curve. Although the rheological curve related to this deformation condition can be classified as a single peak, close observation of the original rheological curve (Figure 5 (a)) shows that it is not a traditional single-peak rheological curve.
After the peak point of the rheological curve, several plateaus (horizontal stress lines) were detected, followed by a decrease in the rheological stress after each plateau. Each plateau period represents an instantaneous plateau period (similar to a peak point). It is possible that the progress of the new DRX cycle caused the flow stress to decrease after each plateau. This condition can be regarded as a transient state of unimodal and multimodal behavior, which is called multi-transient steady state (MTSS) behavior. As shown in Figure 5b, there is overlap between the end of the known cycle of DRX and the beginning of the next cycle. At the end of the cycle, the recrystallization process rate is quite low, and the material is work hardened under simultaneous deformation conditions.
At the same time, the rate of the new DRX cycle increases and softening occurs. These simultaneous processes result in several plateaus after peak stress. Figure 5 (c) shows the microstructure of the sample. The average grain size of the austenite ascertained was 81 μm. Obviously, there is no significant grain refinement in this case, which may be due to the condition being a transient condition between unimodal and multimodal behavior and related to high temperature and low strain rate deformation conditions. Later, we will talk about deformation conditions under high temperature and low strain rate. Figure 5 (c) shows the deformation of the deformed specimen close to the Zener-Hollomon parameter at a strain rate of 0.001 s-1 and a temperature of 1150 ° C. The thermal compression test of similar materials was obtained using Instron equipment Rheological curve. It can be seen from the figure that multiple transient steady state (MTSS) behavior has occurred again, and the smaller Zener-Hollomon parameter will cause cyclic behavior. These results therefore confirm the assumption that the above-mentioned multi-transient steady-state (MTSS) behavior is a transient between unimodal and multimodal behavior. Because unimodal and multimodal behaviors cause grain refinement and grain coarsening, respectively, transients (multi-transient steady state (MTSS) behavior) are critical.
Maybe that the increase in the rate of the recovery process and the decrease in the rate of strain hardening caused the reduction of the flow stress in Figure 3 with the deformation temperature. Since the formation of DRX nuclei is relatively easy at higher temperatures, the critical strain for starting DRX decreases. In addition, the grain boundary surface migration increases with increasing deformation temperature, so the DRX rate increases. So the peak strain and steady state strain decrease with the deformation temperature.
The flow stress that increases with the strain rate can be considered as a decrease in the rate of the recovery process and an increase in strain hardening. The DRV rate also decreases with increasing strain rate. Since the substructure formed by the appearance of DRV in the DRX microstructure is the origin of the DRX core, it is reasonable that the critical strain at the beginning of DRX increases with increasing strain rate. Grain boundary migration decreases with increasing rate, and conversely, increases peak and steady state strain.
3.2 Structural analysis of 17-4PH Stainless Steel
As shown by Sellars and Tegart using the hyperbolic sine function proposed by Garofalo, hot working can be viewed as a thermally activated process and can be described using a strain rate equation similar to that used in creep studies. According to these studies, the Zener-Hollomon parameter (Z), that is, the temperature-compensated strain rate, can be related to different types of flow stress (formula (4)): the power law at relatively low stress, and the Exponential law and hyperbolic sine law for various deformation conditions:
In the formula, Q is the activation energy of hot working; A ‘, A’ ‘, A, n’, n and α (≈β / n ‘) are material constants. The multiplier α is an adjustable constant that reduces ασ to give the correct range of linear and parallel lines in the lnε and ln {sinh (ασ)} curves. In these expressions, the flow stress is related to the absolute temperature and strain rate during deformation. However, since there is no stipulation of the strain for determining the flow stress, the flow stress cannot be fully described by these formulas. To this end, characteristic stresses should be used that represent the same deformation or softening mechanism of all the curves, such as static stress, peak stress, or critical stress at the beginning of DRX. It should also be noted that the nature of the material constant and formula depends on the characteristic stresses used to derive the material constant and formula.
In general, the peak stress is used most often when looking for hot working constants. By taking the natural logarithm from both sides of the expression in formula (4), the following formula for the peak value can be derived: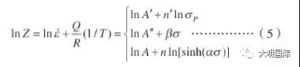
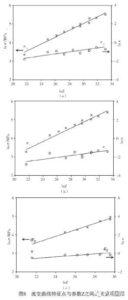
By partial differentiation of these formulas at constant temperature, the equation n ‘= [∂lnε / ∂lnσP] T, β = [∂lnε / ∂σP] T, n = [∂lnε / ∂ln {sinh (ασP )}] To calculate the value of α (≈β / n ‘). Figure 6 (a) shows the required curve. From these results, α = 0.011 can be calculated. This value is slightly different from the conventional value of 0.012 for stainless steel. Usually, the value of α = 0.012 for steel is used in the analysis of the hot deformation research based on the hyperbolic sine law to cause errors.
By performing partial differentiation at the constant strain rate formula shown in formula (5), the following expressions can be determined: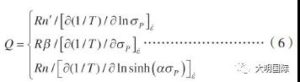
It is obvious that the flow stress, which is extremely dependent on the deformation temperature, will make the activation energy value of deformation larger. It is generated from the following formulas that can be used to obtain the Q slope: (1) the curve of lnε and 1 / T and lnσP based on the law of power; (2) the curve of lnε and 1 / T and σP based on the law of exponents Curves, and (3) curves based on the hyperbolic sine law of lnε and 1 / T and ln {sinh (ασP)}. The required curve is shown in Figure 6 (b). In the power-law equation, the exponential equation, and the hyperbolic sine function equation, the calculated average correction coefficients for the regression analysis of Figure 6 (b) are 0.991, 0.976, and 0.982, respectively. This shows that the power law equation of 337 kJ / mol deformation activation energy obtained in the experimental conditions of this study is appropriate. Values of 543 and 442 kJ / mol were also determined using exponential law and hyperbolic sine law, respectively. Since 17-4 PH stainless steel is austenite under hot working conditions, its behavior can be compared with similar austenitic stainless steels with the same alloying elements. Deformation activation energy values for austenitic stainless steels published in accordance with the relationship QCalc = 13.5 × S ± 25. In this relationship, S is the total weight percent of the metal solute, and QCalc is the activation energy in kJ / mol. For the 17-4 PH stainless steel used in this study (see Table 1), S = 24.7, so QCalc = 333 ± 25 kJ / mol. Therefore, a value of 337 kJ / mol is reasonable.

In many studies, one of the expressions of formula (6) comes from the literature that calculates the apparent activation energy. As the analysis above shows, the calculated values are very different. The deformation activation energy of 337 kJ / mol deviates from the diffusion activation energy in austenite, which is 280 kJ / mol. Although the activation energy of hot working depends on the material, it usually refers to the apparent value, because the internal microstructure state and the curve generated only from the experimental data are usually not considered, and the microstructure is assumed to maintain a constant value 3 3 7 k J / mol is used to calculate the Z parameter. According to formula (5),
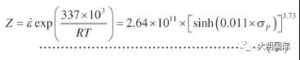
the appropriate values of n and A can be obtained by using the curves of lnZ and ln {sinh (ασP)} (Fig. 6 (c)). These analyses lead to the following constitutive equations:
3.3 Characteristic points of the DRX rheological curve
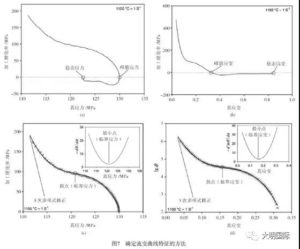
Onset of DRX can be detected based on changes in the curve of the relationship between θ and σ or according to the minimum of the -dθ / dσ and σ curves (before the peak stress of these two curves). The latter curve is used to detect the critical stress (σC) at which DRX is initiated. Moreover, the peak stress (σP), steady-state stress (σs), and peak strain (εP) at the start of DRX (εC) were detected using the inflection points in the θ-σ relationship curve, θ-ε relationship curve, and θ-ε curve, respectively. ), Steady state strain (εs) and critical strain (εC). Fig. 7 shows a method for determining characteristic points of a rheological curve by using a work hardening rate. For example, the exact values of peak stress and peak strain are determined when θ = 0 first appears in the θ-σ curve and θ-ε curve, respectively. Figure 8 shows the relationship between the characteristic points of the rheological curve and Z. A regression analysis of these curves and taking into account the Z / A dimensionless parameters yields the following expressions: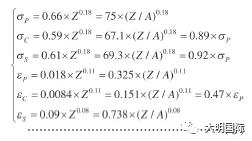
In formula, the stress value is expressed in MPa, and the Z index of the peak strain of 0.11 is the same as that in the literature, between 0.09 and 0.22. Normalized critical stress and strain can be expressed by σC / σP = 0.89 and εC / εP = 0.47, respectively. The normalized critical stress values of AISI 304 austenitic stainless steel reported in the literature are very similar. Studies have shown that DRX begins when the normalized strain reaches a value of 0.47. This value is close to the value of AISI 304 stainless steel reported in the previous literature, and is also in the range of 0.3 to 0.9 for various steels reported.
3.4 Thermal deformation microstructure of 17-4PH Stainless Steel


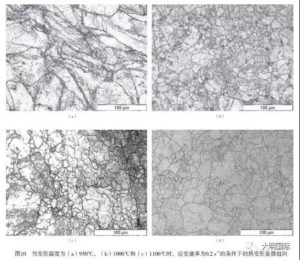
Figure 9 shows the microstructure of thermal deformation under different strain rate conditions when the deformation temperature is 1150 ° C for 17-4PH Stainless Steel. The figure shows that the average grain size increases with decreasing strain rate.